
flowchart TB
    rct("Randomised controlled trial")
Epidemiology as driver of personalised transplantation care
Kidney transplantation and cardiovascular disease
Post-KTx risks


Post-KTx risks
Post-KTx risks

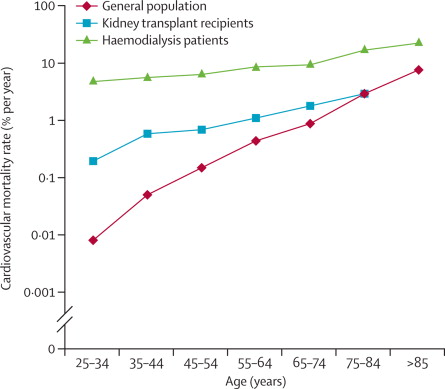
Post-KTx risks
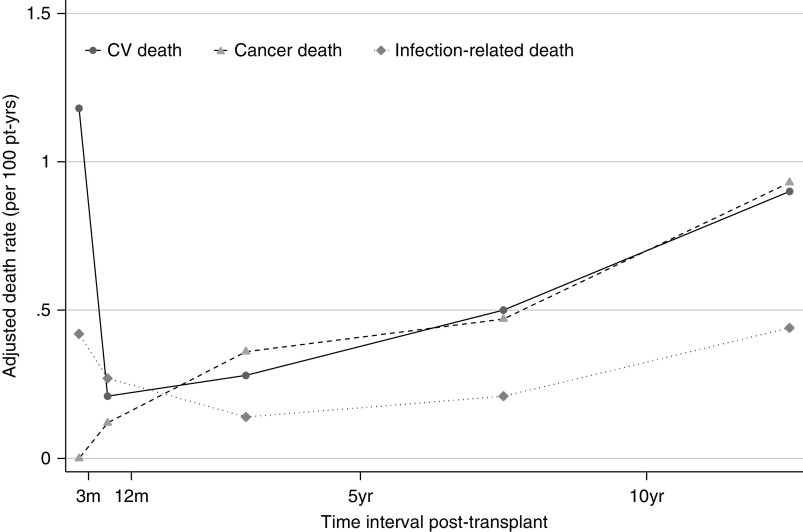
Post-KTx risks
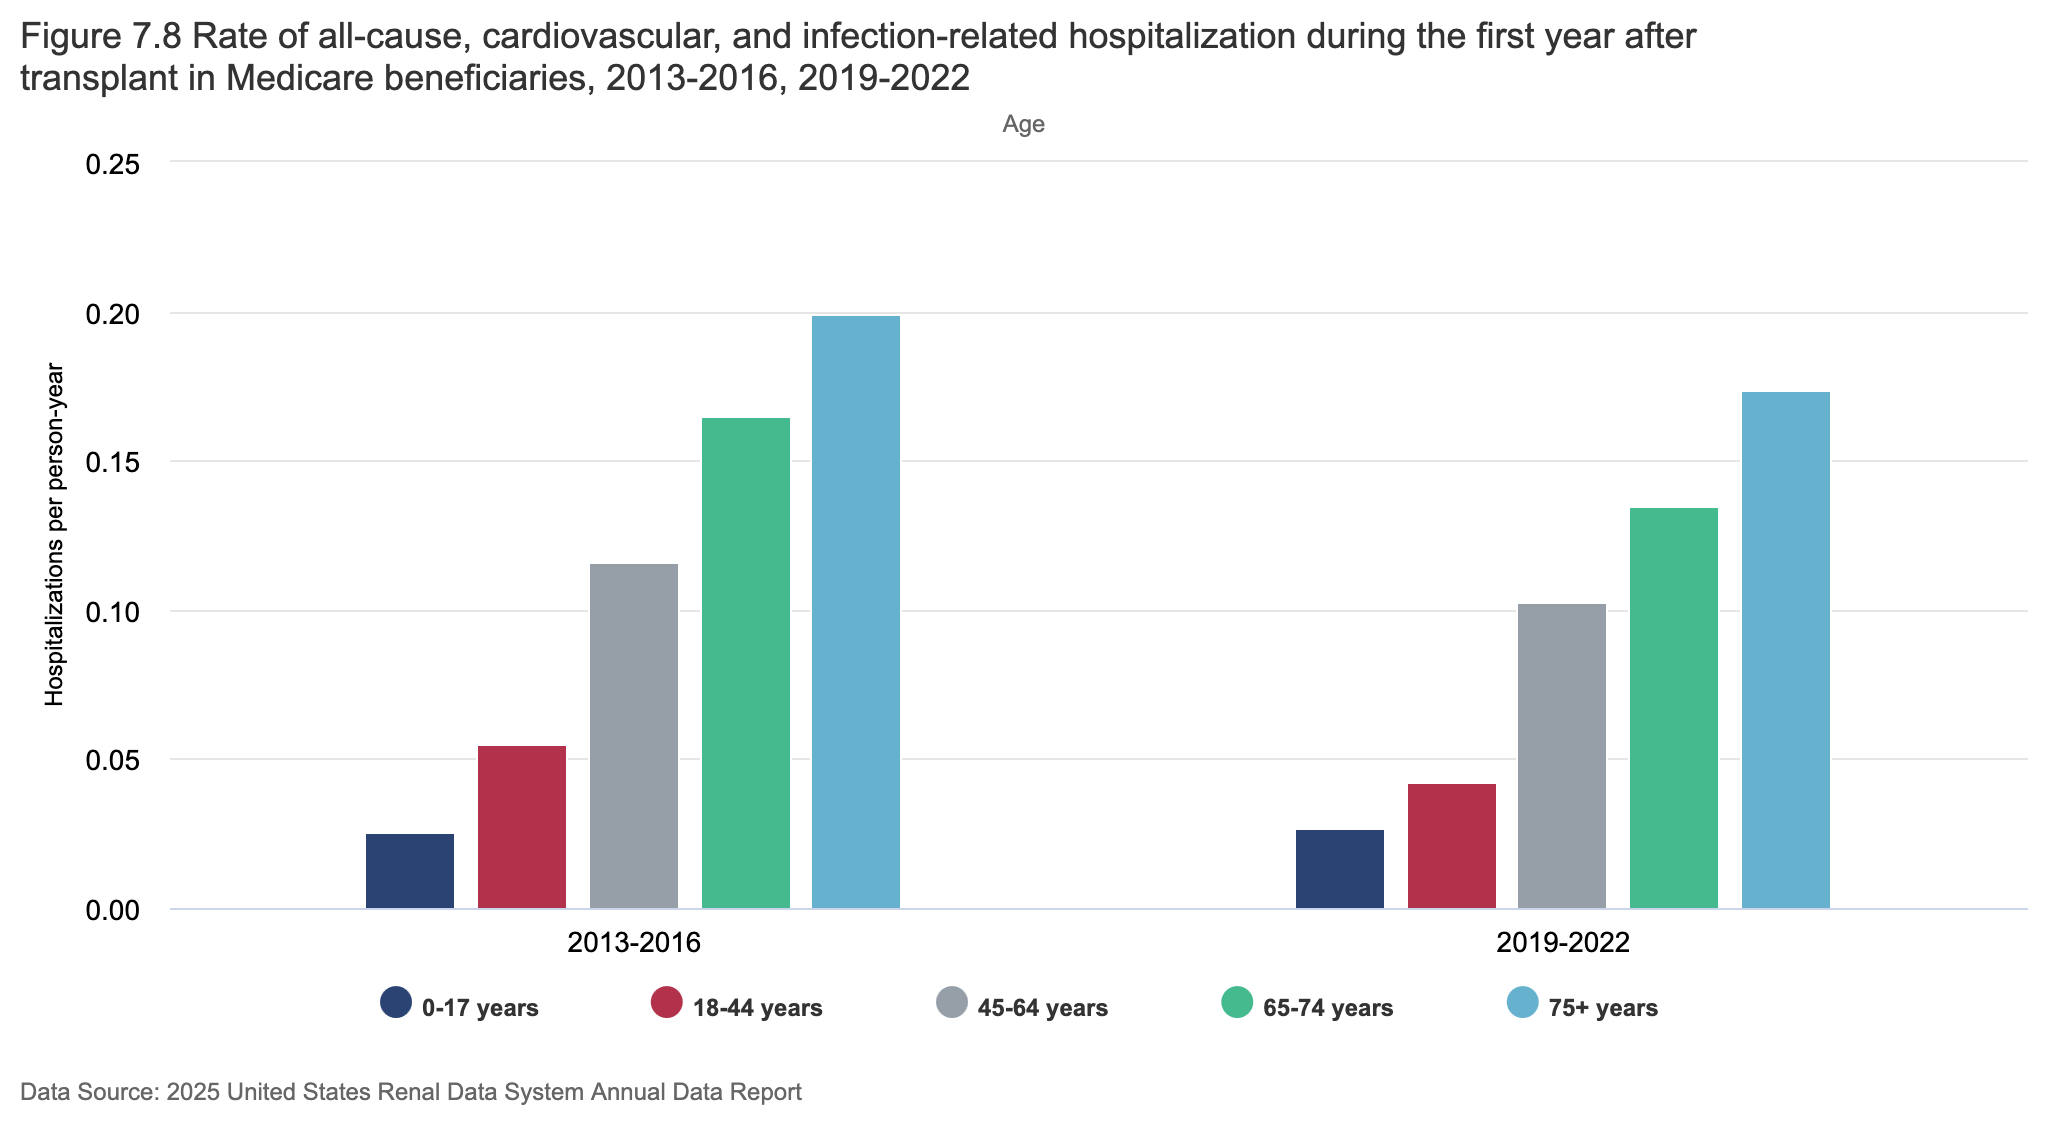
Post-KTx risks
Cardiovascular prevention
| Risk factor |
|---|
| Hypertensiona,b |
| Diabetes mellitusa,b |
| Smoking |
| Dyslipidaemiaa,b |
| Obesitya |
Cardiovascular prevention
| Risk factor | Pharmaceutical treatment |
|---|---|
| Hypertensiona,b | ACEis, ARBs, CCBs |
| Diabetes mellitusa,b | Metformin, SU derivates, SGLT2is, GLP1-RAs, Insulin |
| Smoking | |
| Dyslipidaemiaa,b | Statins |
| Obesitya | Metformin, GLP1-RAs |
Underlying evidence
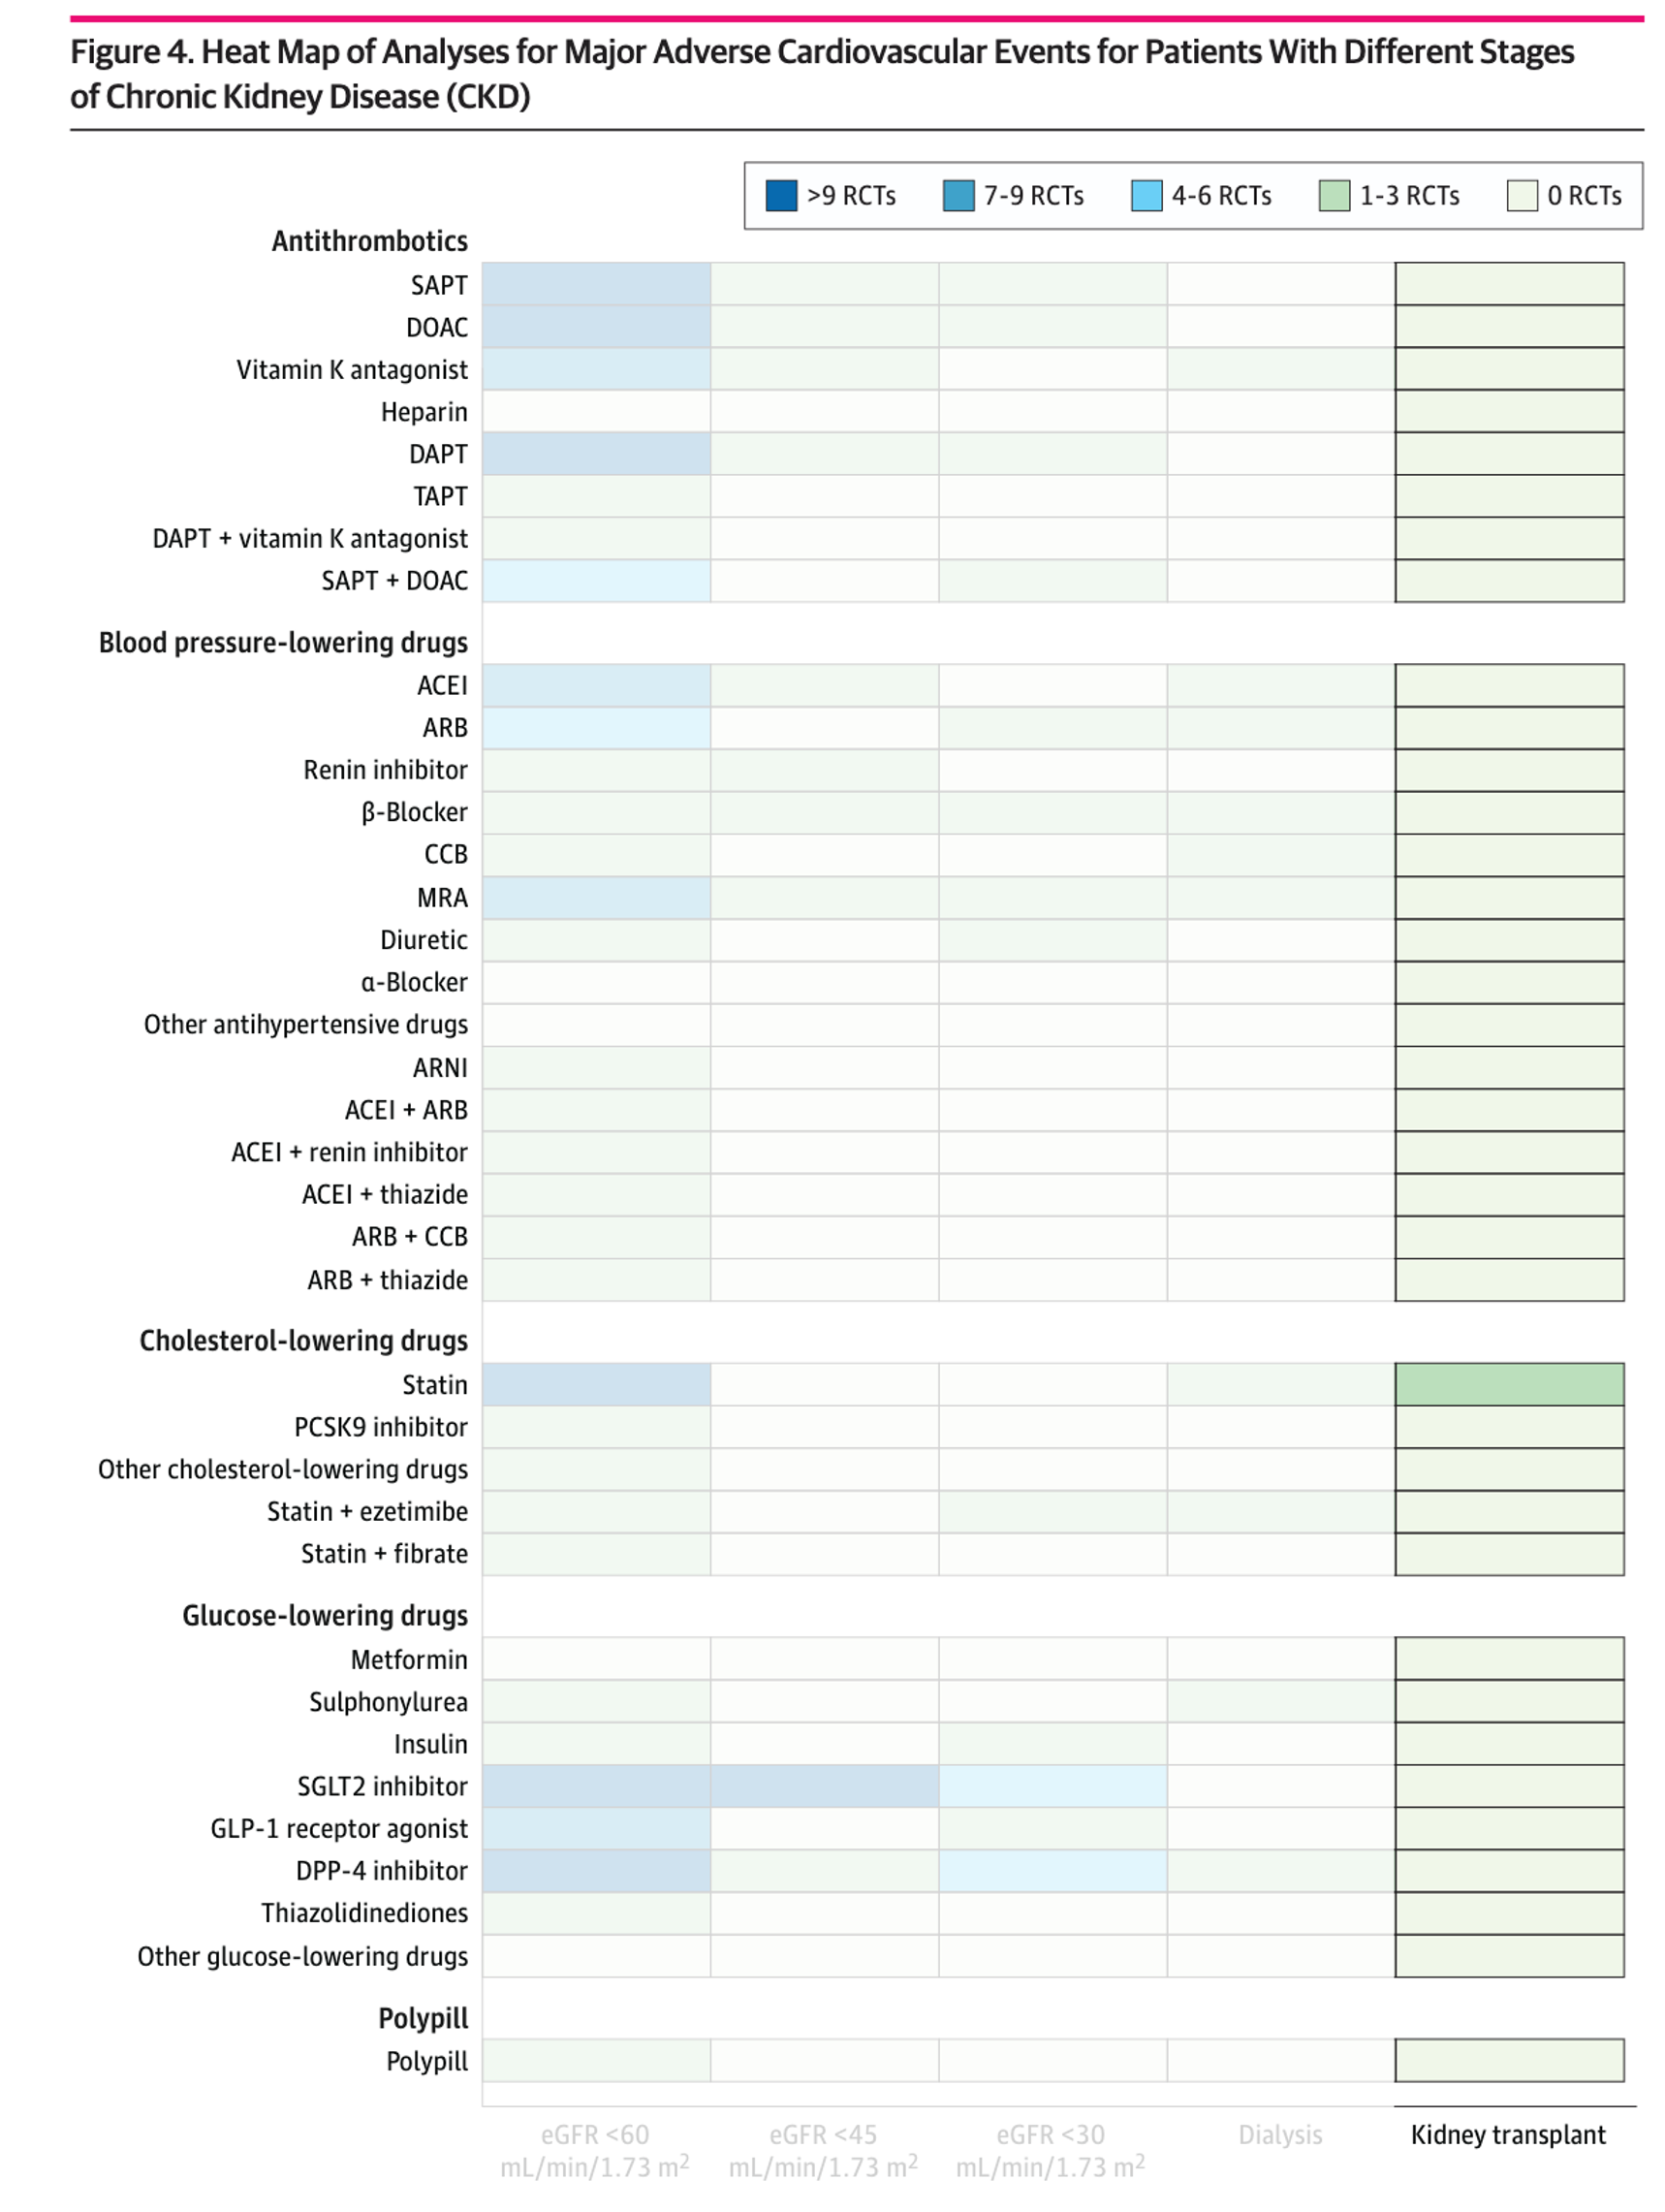
RCTs for evidence-based medicine
RCT-based evidence
RCT-based evidence
flowchart TB
    rct("Randomised controlled trial") --> ma["Main analysis"]
RCT-based evidence
flowchart TB
    rct("Randomised controlled trial") --> ma["Main analysis"]
    ma --> ate(["Average treatment effect (ATE)"])
Average treatment effect
The Average treatment effect (ATE) is the average effect in the total population
- The main analysis of our RCT on drug A vs. placebo yields a risk reduction of 20% for cardiovascular events
- If we prescribe drug A to this population, the population will experience 20% less cardiovascular events
- An individual may have a different risk reduction: 10%, 30%, -5%
- But the average of all those individuals will be 20%
- This is useful for people who treat populations (policy makers)
- This is less useful for people who treat individuals (clinicians)
RCT-based evidence
flowchart TB
    rct("Randomised controlled trial") --> ma["Main analysis"]
    ma --> ate(["Average treatment effect (ATE)"])
    ate --> pop("Population")
RCT-based evidence
flowchart TB
    rct("Randomised controlled trial") --> ma["Main analysis"]
    ma --> ate(["Average treatment effect (ATE)"])
    ate --> pop("Population")
    rct --> sa["Subgroup analysis"]
RCT-based evidence
flowchart TB
    rct("Randomised controlled trial") --> ma["Main analysis"]
    ma --> ate(["Average treatment effect (ATE)"])
    ate --> pop("Population")
    rct --> sa["Subgroup analysis"]
    sa --> cate(["Conditional average <br> treatment effect (CATE)"])
Conditional average treatment effect
The conditional average treatment effect (CATE) is the average treatment effect in a subgroup of the population
- We perform a subgroup analysis on biological sex, which yields a risk reduction of 30% for women and 12% for men
- If we prescribe drug A to this population, the population will experience 20% less cardiovascular events
- But the population of women will experience 30% less cardiovascular events
- And the population of men will experience 12% less cardiovascular events
- An individual woman or an individual man may still have a different risk reduction: 10%, 30%, -5%
- This is slightly useful for people who treat populations (policy makers)
- This is slightly useful for people who treat individuals (clinicians)
Conditional average treatment effect
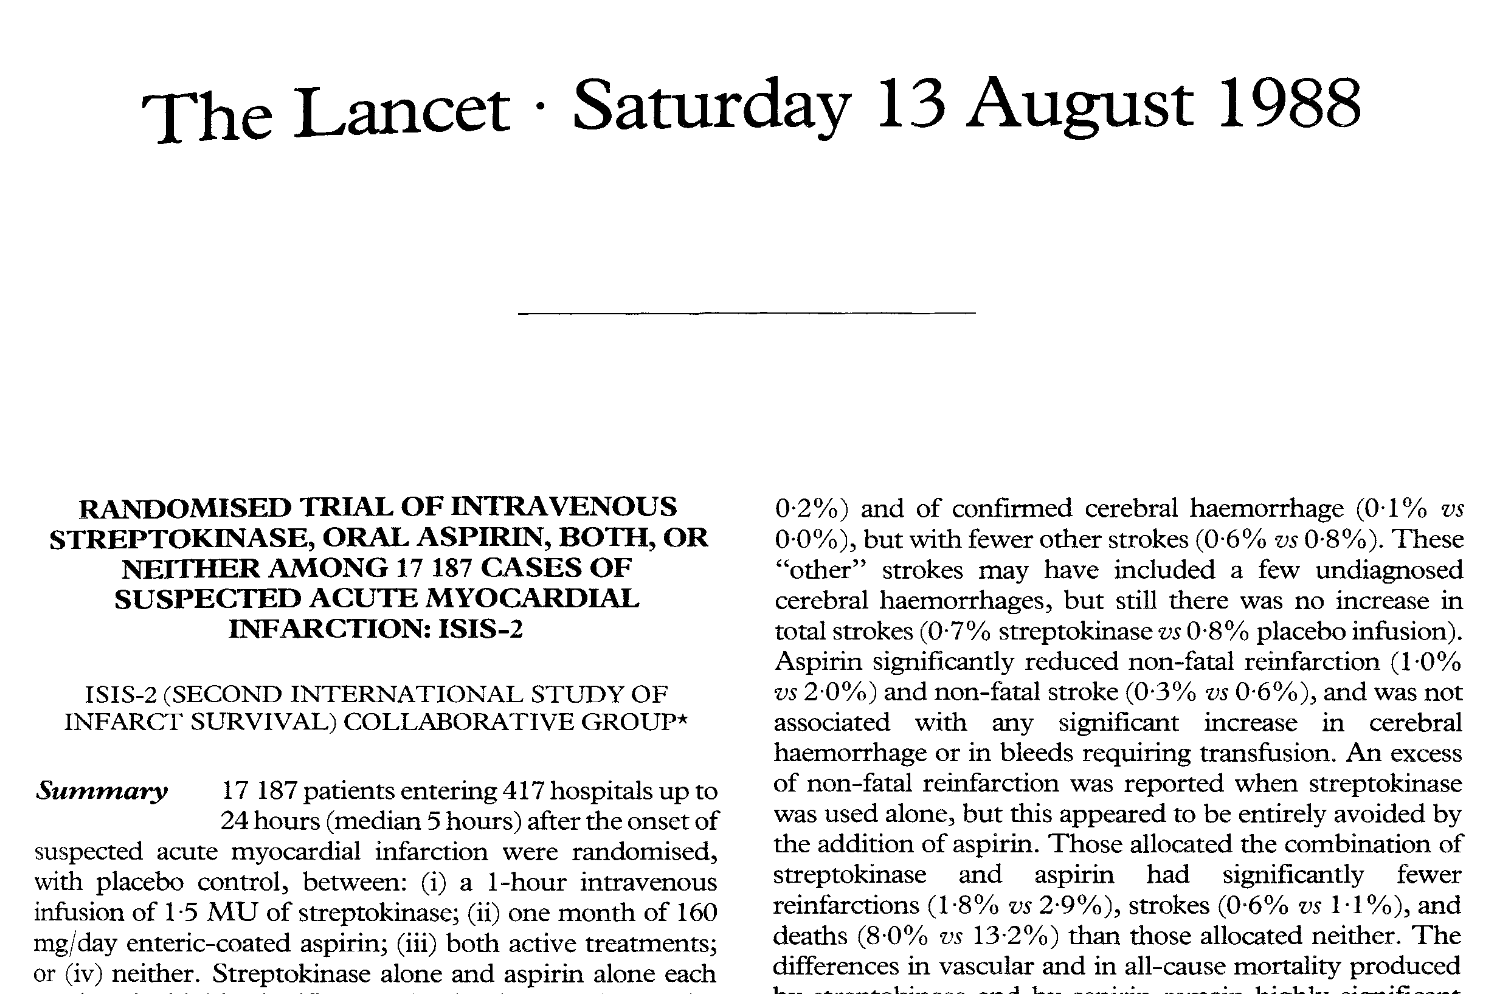
Conditional average treatment effect
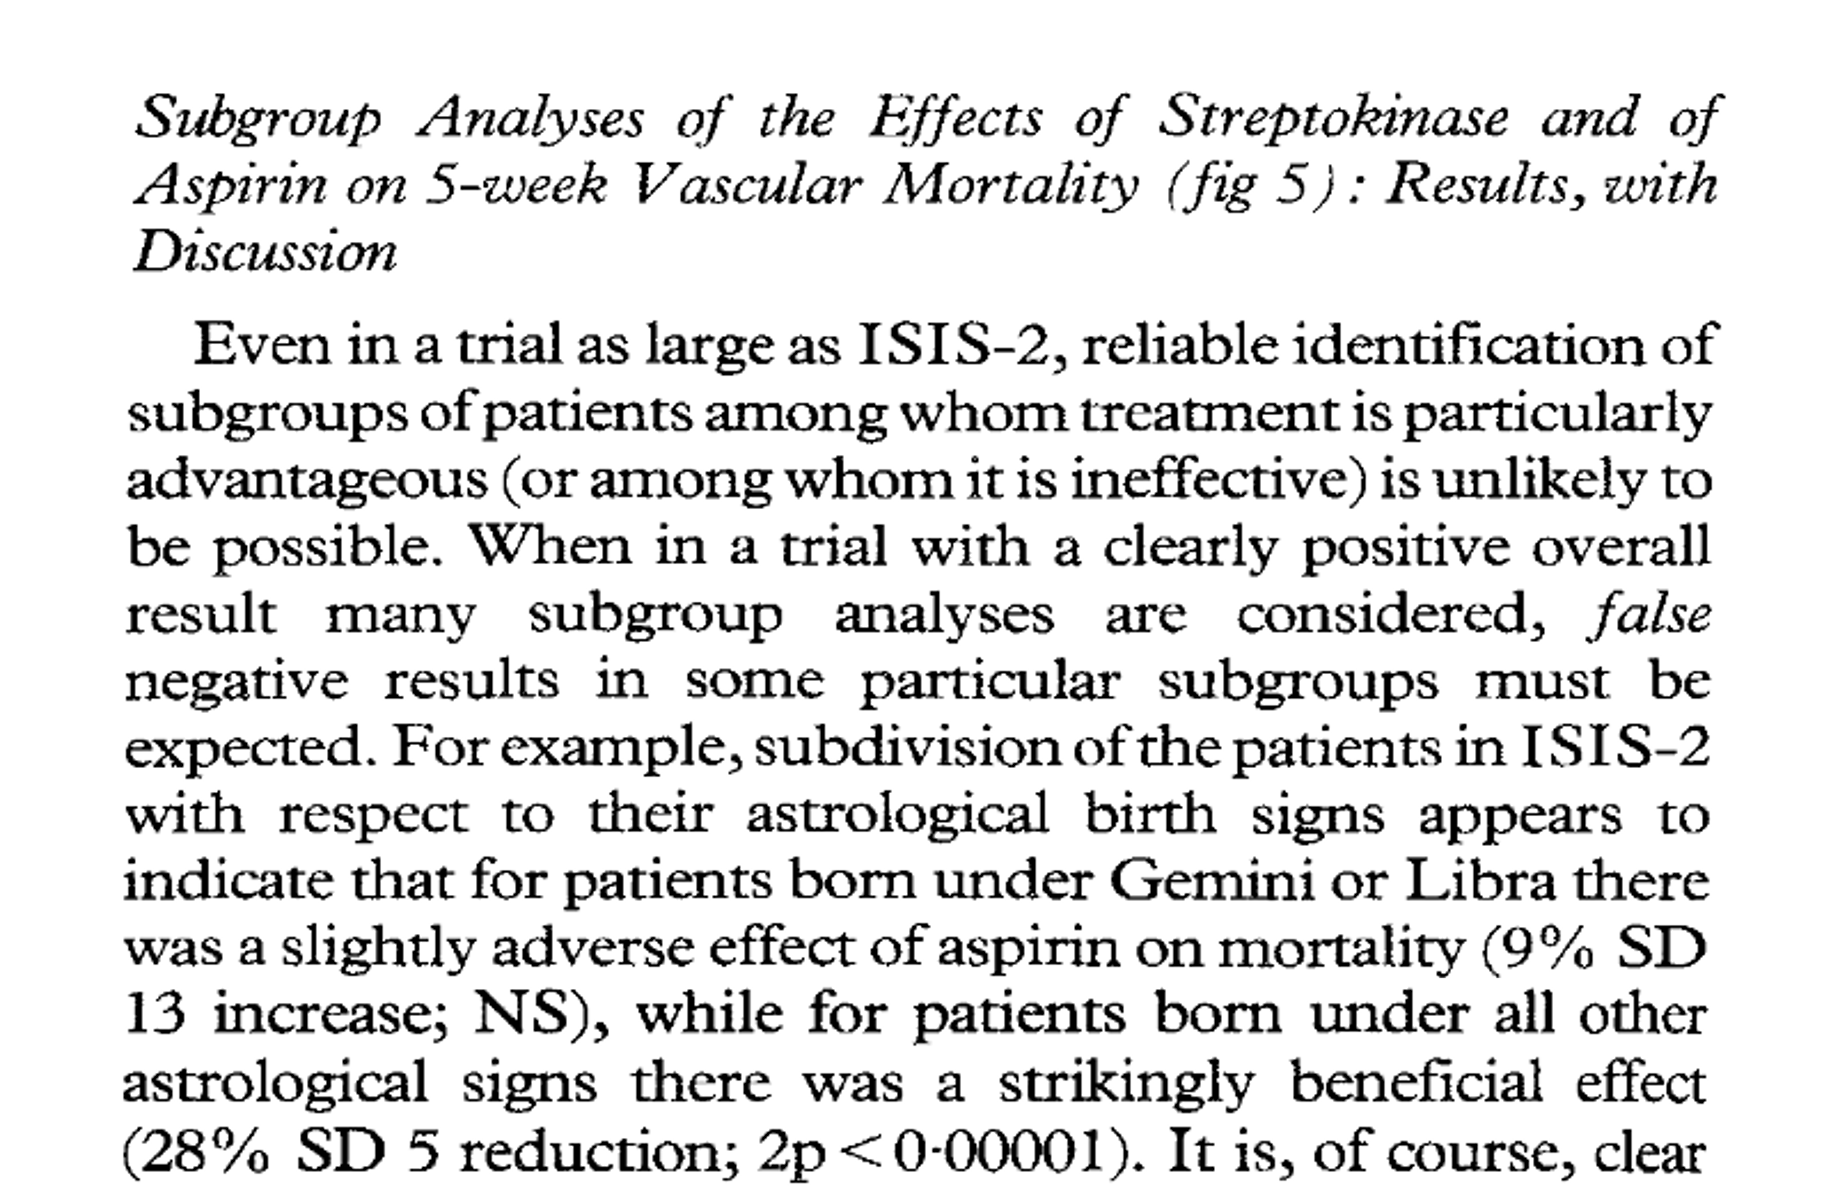
Conditional average treatment effect

Conditional average treatment effect
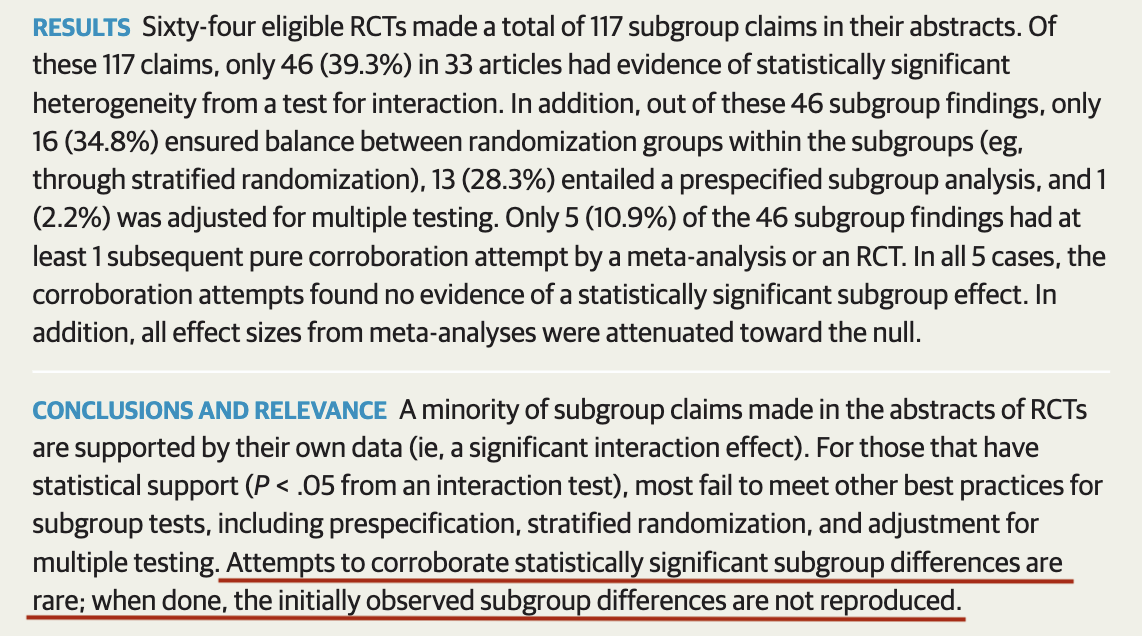
RCT-based evidence
flowchart TB
    rct("Randomised controlled trial") --> ma["Main analysis"]
    ma --> ate(["Average treatment effect (ATE)"])
    ate --> pop("Population")
    rct --> sa["Subgroup analysis"]
    sa --> cate(["Conditional average <br> treatment effect (CATE)"])
RCT-based evidence
flowchart TB
    rct("Randomised controlled trial") --> ma["Main analysis"]
    ma --> ate(["Average treatment effect (ATE)"])
    ate --> pop("Population")
    rct --> sa["Subgroup analysis"]
    sa --> cate(["Conditional average <br> treatment effect (CATE)"])
    cate --> subpop("Subgroups in population")
Individualised treatment effects
RCT-based evidence
flowchart TB
    rct("Randomised controlled trial") --> ma["Main analysis"]
    ma --> ate(["Average treatment effect (ATE)"])
    ate --> pop("Population")
    rct --> sa["Subgroup analysis"]
    sa --> cate(["Conditional average <br> treatment effect (CATE)"])
    cate --> subpop("Subgroups in population")
    rct --> magic["?"]
RCT-based evidence
flowchart TB
    rct("Randomised controlled trial") --> ma["Main analysis"]
    ma --> ate(["Average treatment effect (ATE)"])
    ate --> pop("Population")
    rct --> sa["Subgroup analysis"]
    sa --> cate(["Conditional average <br> treatment effect (CATE)"])
    cate --> subpop("Subgroups in population")
    rct --> magic["?"]
    magic --> ite(["Individual treatment effect"])
Individual treatment effect
The individual treatment effect is the treatment effect for an individual
- We assign drug A to an individual
- We open an alternative universe where everything is exactly the same, but we do not assign drug A to that individual
- The difference in their outcomes is the individual treatment effect
Individualised treatment effect
The individualised treatment effect (ITE) is a highly specific conditional treatment effect
- We calculate the effect (CATE) based on many variables at once
- The CATE becomes so specific, that we consider it individualised
- For instance, drug A will give a 53-year old woman with diabetes, no cardiovascular history, a kidney function of 55 mL/min/1.73m2, with an increased lymphocyte count and who is using tacrolimus, mycophenolate, and basiliximab, as well as a renin-angiotensin-system inhibitor, a risk-reduction of 35%
- This is useful for people who treat individuals (clinicians)
Individualised treatment effect
To calculate the ITE, we can use two methods:
Risk modelling:
- Using a (valid) existing prediction model, we perform a subgroup analysis by predicted outcome risk
Because we rarely make many subgroups, I would not consider this an ITE

Individualised treatment effect
To calculate the ITE, we can use two methods:
Effect modelling:
- Directly predict the outcome if an individual was treated
- Directly predict the outcome if an individual was not treated
- Subtracting these predictions gives the ITE
Individualised treatment effect
Important
Both methods assume that there is no confounding left between the groups
If there is no confounding, we can use untreated individuals to predict what would have happened to the treated individuals, and vice versa
Using sophisticated study designs/statistical techniques, we can remove confounding in our study population
Individualised treatment effect
Important
The ITE is a prediction: it is what we expect, but we do not know for sure if it is true (and never will)
We thus need to validate the prediction, using special methods that take into account our limited knowledge
RCT-based evidence
flowchart TB
    rct("Randomised controlled trial") --> ma["Main analysis"]
    ma --> ate(["Average treatment effect (ATE)"])
    ate --> pop("Population")
    rct --> sa["Subgroup analysis"]
    sa --> cate(["Conditional average <br> treatment effect (CATE)"])
    cate --> subpop("Subgroups in population")
    rct --> magic["?"]
    magic --> more_magic(["Individual treatment effect"])
RCT-based evidence
flowchart TB
    rct("Randomised controlled trial") --> ma["Main analysis"]
    ma --> ate(["Average treatment effect (ATE)"])
    ate --> pop("Population")
    rct --> sa["Subgroup analysis"]
    sa --> cate(["Conditional average <br> treatment effect (CATE)"])
    cate --> subpop("Subgroups in population")
    rct --> magic["?"]
    magic --> more_magic(["Individual treatment effect"])
    more_magic --> ind("Individual people")
RCT-based evidence
flowchart TB
    rct("Randomised controlled trial") --> ma["Main analysis"]
    ma --> ate(["Average treatment effect (ATE)"])
    ate --> pop("Population")
    rct --> sa["Subgroup analysis"]
    sa --> cate(["Conditional average <br> treatment effect (CATE)"])
    cate --> subpop("Subgroups in population")
    rct --> path["Risk/effect modelling"]
    rct --> magic["?"]
    magic --> more_magic(["Individual treatment effect"])
    more_magic --> ind("Individual people")
RCT-based evidence
flowchart TB
    rct("Randomised controlled trial") --> ma["Main analysis"]
    ma --> ate(["Average treatment effect (ATE)"])
    ate --> pop("Population")
    rct --> sa["Subgroup analysis"]
    sa --> cate(["Conditional average <br> treatment effect (CATE)"])
    cate --> subpop("Subgroups in population")
    rct --> path["Risk/effect modelling"]
    path --> ite(["Individualised treatment <br> effect (ITE)"])
    rct --> magic["?"]
    magic --> more_magic(["Individual treatment effect"])
    more_magic --> ind("Individual people")
RCT-based evidence
flowchart TB
    rct("Randomised controlled trial") --> ma["Main analysis"]
    ma --> ate(["Average treatment effect (ATE)"])
    ate --> pop("Population")
    rct --> sa["Subgroup analysis"]
    sa --> cate(["Conditional average <br> treatment effect (CATE)"])
    cate --> subpop("Subgroups in population")
    rct --> path["Risk/effect modelling"]
    path --> ite(["Individualised treatment <br> effect (ITE)"])
    ite --> ind("Individual people")
    rct --> magic["?"]
    magic --> more_magic(["Individual treatment effect"])
    more_magic --> ind
A final note
Sample size struggles
flowchart TB
    rct("Randomised controlled trial") --> ma["Main analysis"]
    ma --> ate(["Average treatment effect (ATE)"])
    ate --> pop("Population")
    rct --> sa["Subgroup analysis"]
    sa --> cate(["Conditional average <br> treatment effect (CATE)"])
    cate --> subpop("Subgroups in population")
    rct --> path["Risk/effect modelling"]
    path --> ite(["Individualised treatment <br> effect (ITE)"])
    ite --> ind("Individual people")
    rct --> magic["?"]
    magic --> more_magic(["Individual treatment effect"])
    more_magic --> ind

%% Custom style for node CATE and ITE
style cate fill:#F9A03F,stroke:#C36F09
style ite fill:#E79E9C,stroke:#6F1D1B
Sample size struggles
flowchart TB
    rct("Pooled RCTs/<br>observational data") --> ma["Main analysis"]
    ma --> ate(["Average treatment effect (ATE)"])
    ate --> pop("Population")
    rct --> sa["Subgroup analysis"]
    sa --> cate(["Conditional average <br> treatment effect (CATE)"])
    cate --> subpop("Subgroups in population")
    rct --> path["Risk/effect modelling"]
    path --> ite(["Individualised treatment <br> effect (ITE)"])
    ite --> ind("Individual people")
    rct --> magic["?"]
    magic --> more_magic(["Individual treatment effect"])
    more_magic --> ind
Thank you!
- Web: rjjanse.github.io
- Contact: r.j.janse-5@umcutrecht.nl
- Slides: rjjanse.github.io/talks