
| entrytime | survtime | censorid | unit | exptheta | psival | age | sex | BMI | |
|---|---|---|---|---|---|---|---|---|---|
| 4775 | 59 | 4 | 1 | 10 | 1.089509 | 1.0 | 52 | male | 23.61 |
| 13218 | 431 | 55 | 1 | 21 | 0.428315 | 1.0 | 69 | male | 25.41 |
| 17401 | 31 | 17 | 1 | 27 | 1.106653 | 1.5 | 56 | female | 17.08 |
| 24388 | 166 | 31 | 1 | 37 | 1.252265 | 1.0 | 60 | male | 27.01 |
| 26753 | 319 | 38 | 1 | 40 | 1.429925 | 1.0 | 49 | female | 31.44 |
P(robabilities), E[xpectations], and the Truth
Rationale
Understanding >>> Doing
Want to know which test to use: Wikistatistiek AMC Toetskeuzetabel
Want to know how SPSS works: Youtube
Disclaimer
I am not a statistician nor philosophist
We want to apply probability so:
We focus on developing an intuitive feeling for probability, foregoing unnecessary detail for application.
Agenda
- Conflating Probability and Reality
- Probability: Our Fake Best Friend
- Expectations Instead of Probabilities
- Maximising experience (or scientific FOMO)
- How Can We Make the Truth Probable?
Conflating Probability and Reality
What is Probability?
A reflection of our uncertainty:
- It will probably be…
- The likelihood that…
- There is a risk of…
- We have a chance to…
- I expect that…
What is Probability?
Specifically, the chance that some phenomenon \(Y\) occurs.
E.g. the chance of perforation during PCI
Expressed as either a percentage (bounded by 0% and 100%), or a proportion (bounded by 0 and 1).
What is Probability?
We denote the probability of \(Y\) as \(P(Y)\)
(and sometimes as \(Pr(Y)\) or \(\mathbb{P}(Y)\))
If the probability is conditional on some factor \(X\), we use \(|\): \(P(Y|X)\), which reads as the probability of Y given X
For instance the probability of perforation during PCI given that the patient is >70 years old.
\(P(Y|X>70)\)
Is Probability?
Is there still probability beyond our own (ignorance-driven) uncertainty?
What we believe influences the way we think about probability.
Deterministic worldview
The future can be perfectly predicted if we understood all moving parts.
Stochastic worldview
The future cannot be perfectly predicted, even if we understood all moving parts.
Truly (non-negligible) random processes exist
Dealing With a Complex World
Regardless of our worldview, our technology is too primitive to make deterministic statements about:
| our world | e.g. the prevalence of heart failure |
| our actions | e.g. the effect of a heart transplantation on survival |
| the future | e.g. who is most likely to get a complication during surgery |
Dealing With a Complex World
Our solution?
Take a guess of the probability
Based on experience
Expectations Instead of Probabilities
Continuous Expectations
Probabilities apply the occurrence of phenomena.
In other words: ‘Did an event happen or not?’
However, we may also want to say something about continuous values:
- What is the average height?
- What is the expected future quality of life?
- How does this procedure improve functioning as measured on some scale?
Continuous Expectations
Probabilities do not apply to continuous values.
Instead, we talk about the expected value of some continuous value \(Y\):
\(E(Y)\) (or \(\mathbb{E}(Y)\))
This is generally the same as the mean.
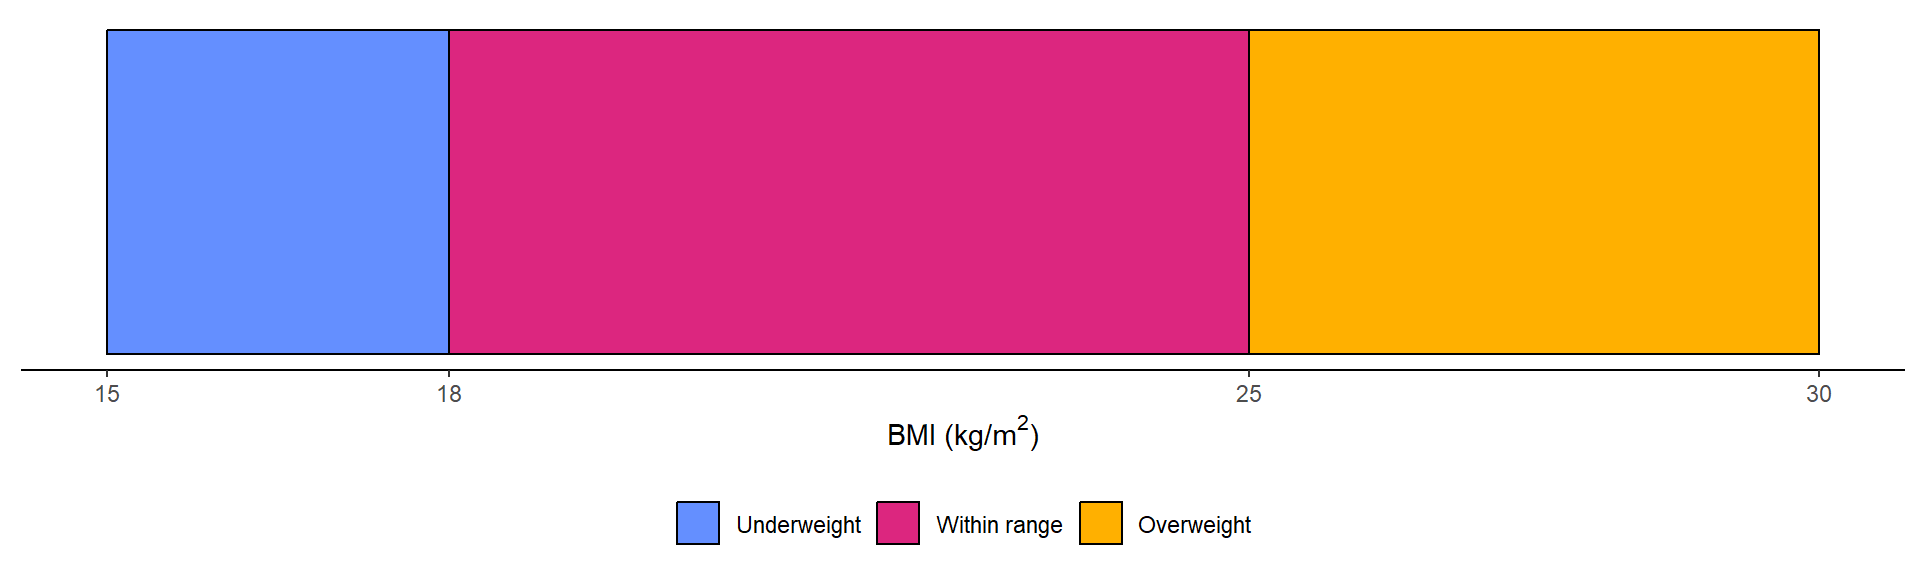
Continuous Expectations
Sometimes (often), people will want to categorise continuous measures
Maximising experience (or scientific FOMO)
Gaining Experience (Sampling)
Gaining Experience (Sampling)
Gaining Experience (Sampling)
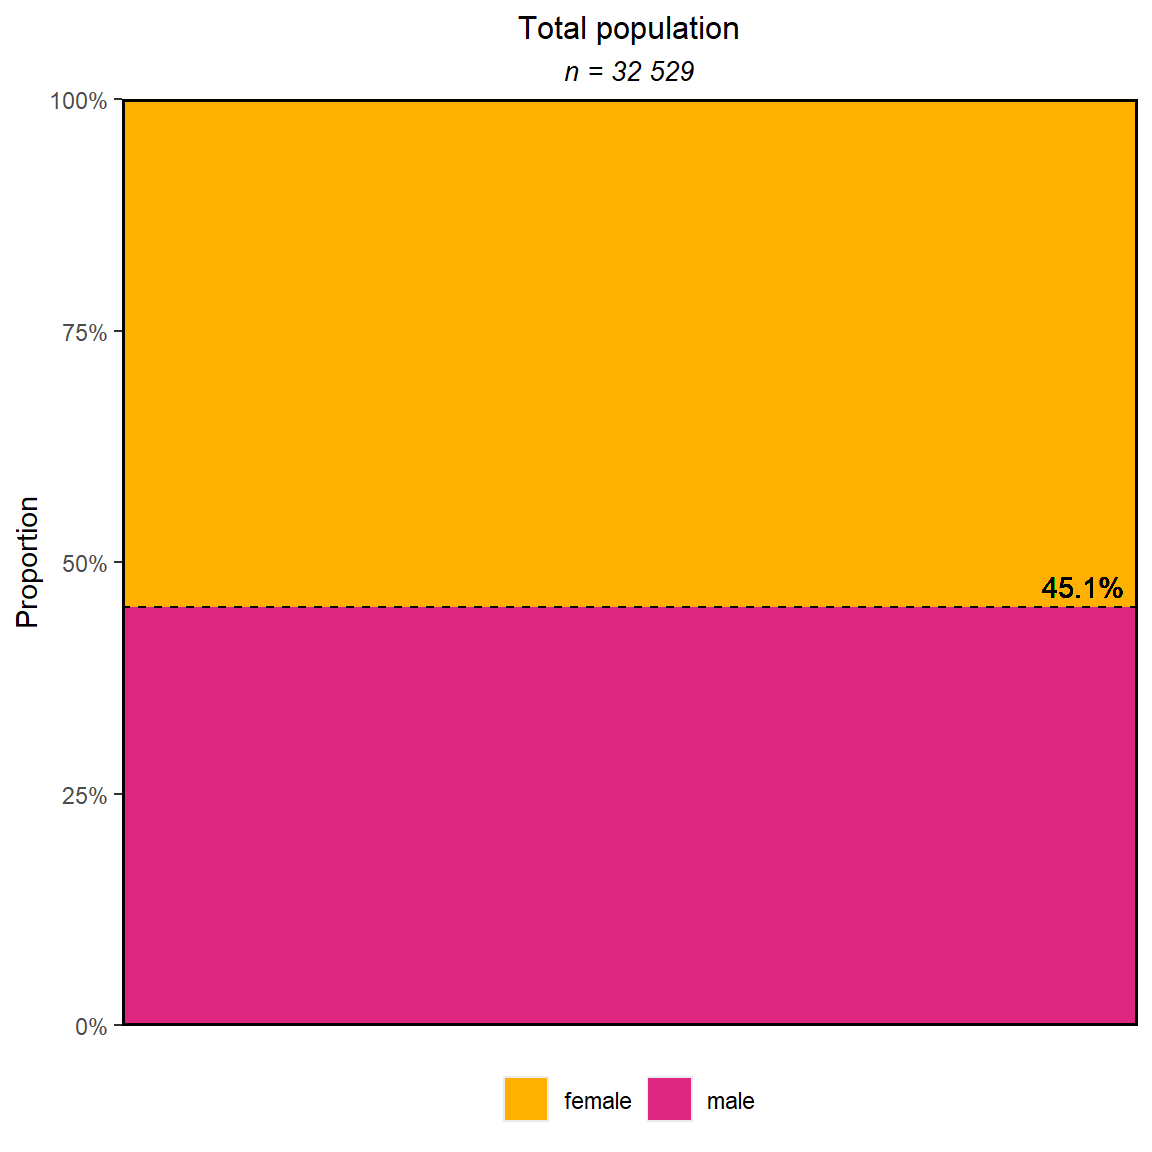
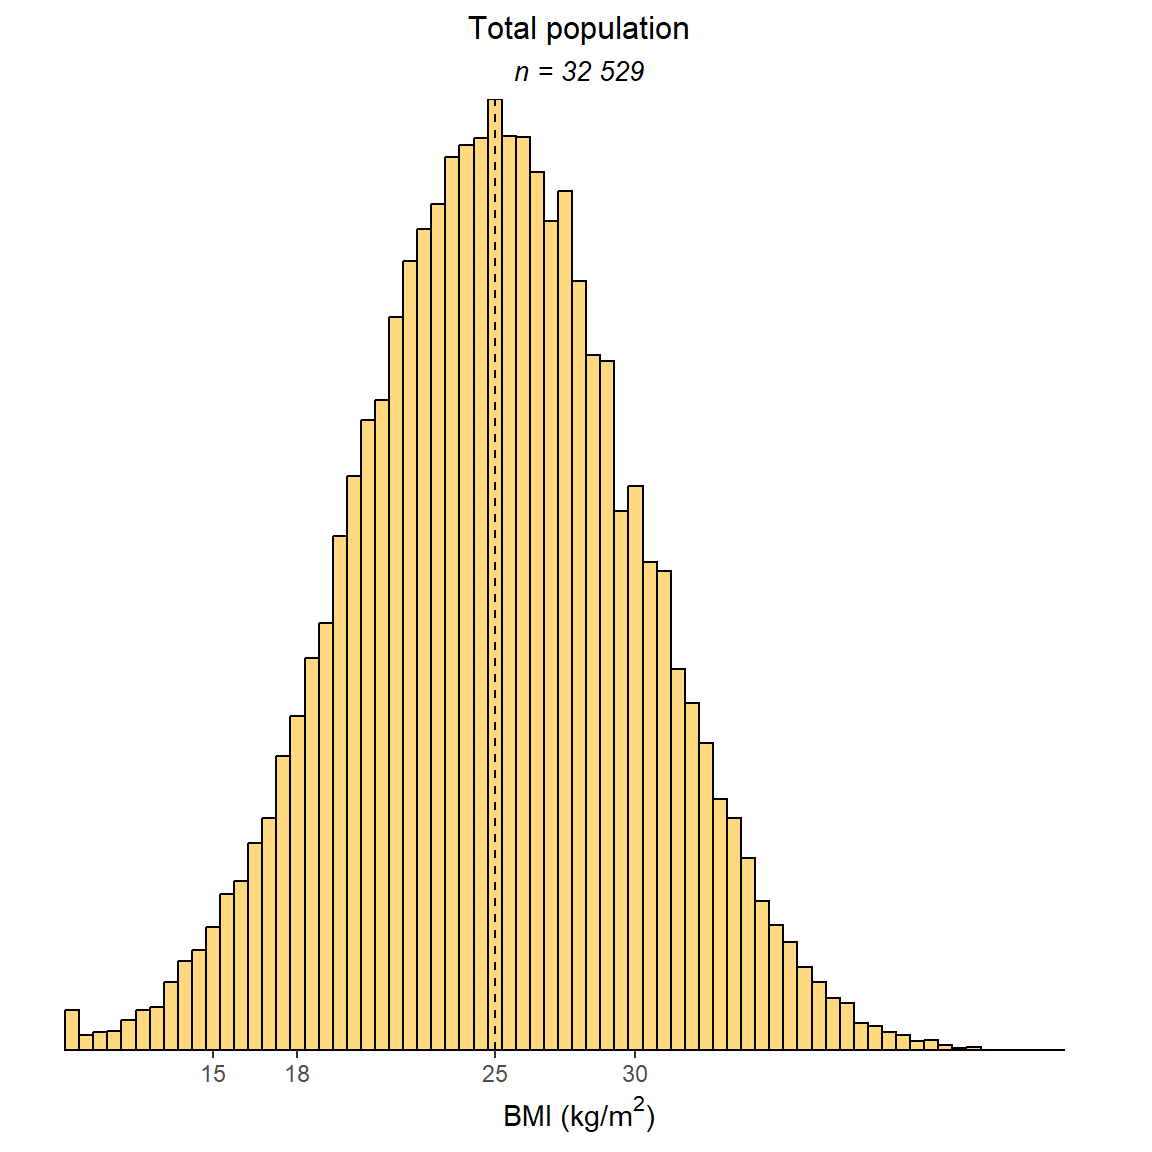
Importantly:
Which (theoretical) population are we sampling?
Try sampling for yourself:
UU Sampling App
Minimally Required Experience
Three approaches:
Calculate sample size
- Only works beforehand
- Prior data must be available
Convenience sample size
- Sample might still not be sufficient
Simulate sample size
- Prior data must be available
Minimally Required Experience
Some well-established calculations
| Focus | Study type | Outcome type | Calculation |
|---|---|---|---|
| Causal | Any | Continuous & Dichotomous | Jansen et al. |
| Diagnostic | Any | Dichotomous | Buderer et al. |
| Prognostic | Development | Continuous | Riley et al. & Whittle et al. |
| Prognostic | Development | Dichotomous | Riley et al. & Riley et al. |
| Prognostic | Development | Survival | Riley et al. & Riley et al. |
| Prognostic | Validation | Continuous, Dichotomous & Survival | Riley et al. |
etc…
Population focus
- Experience = observations = (often) individual people
- For the individual, \(P(Y)\) will be 1 or 0 and \(E(Y)\) may not exist
- The average individual is a myth: Daniels’ The Average Man
- Traditional RCTs give us population effects (interesting for policy-makers)
- Modern methods give us individualised effects (interesting for healthcare providers)
- Ecological fallacy: …when conclusions about individuals are drawn from conclusions about the total population…
How Can We Make the Truth Probable?
Thinking About Truth
Frequentist thinking
- How (statistical) scientists are trained to think
- There is some true \(P(Y)\) or \(E(Y)\) in the long run
- Based on our hypothesis of that true value, would we expect these data? or:
- \(P(data|hypothesis)\)
- Requires frequent sampling
Bayesian thinking
- How humans tend to think
- We only have our current experience to inform us
- Based on what we have seen so far (prior data), what will we see next (posterior data)? or:
- \(P(hypothesis|data)\)
- Requires good priors
Thinking About Truth
The way of thinking is situation-dependent:
- A fair die: frequentist approach
- An unfair die: Bayesian approach
Most importantly, reflect on how you think and, on the situation, and choose what is appropriate.
A Look Inside the Frequentist Toolbox
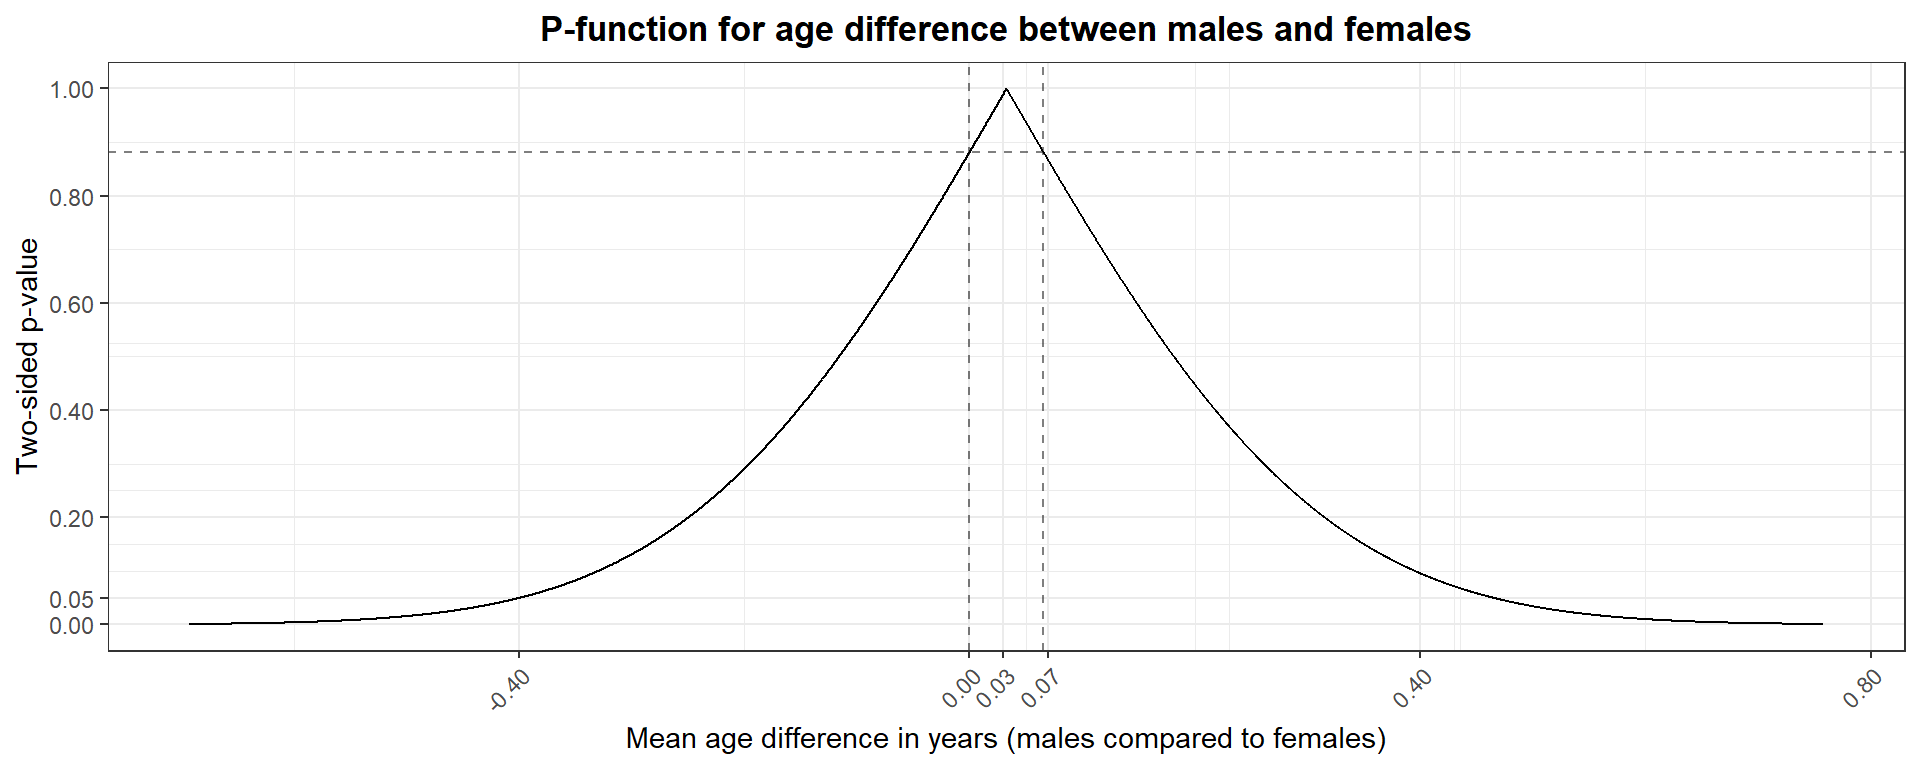
P-values
A p-value is the probability of your observed difference or larger occurring, given that there is not actually a difference (i.e. probability of type 1 error / false positive).
Often dichotomised (p-value < 0.05), leading to loss of information.
A Look Inside the Frequentist Toolbox
Confidence intervals
The confidence interval contains the true value in 95% of all confidence intervals for the corresponding hypothesis.
This means that the probability of any specific confidence interval containing the truth is either 0% or 100%!
The confidence interval relates directly to the p-value. If a 95% confidence interval contains the null-value, the p-value will be > 0.05). Resultingly, confidence intervals are also often interpreted as a dichotomy.
A Look Inside the Frequentist Toolbox
Bootstrapping
Re-performing your analyses on different samples drawn from your sample.
Assumption 1: our data contains (for the majority) all types of observations that may occur.
Assumption 2: those observations may occur in different frequencies in different samples.
We draw random individuals from our data (with replacement!) to create a new sample.
A Look Inside the Frequentist Toolbox
Bootstrapping

Closing Remarks
To work with probability, we need to understand it.
There are many philosophical ideas that describe how we think about statistics and
There are many statistical ideas that describe how statistics (and its measures, such as probability) can work.
A scientist working with statistics is responsible to have at least a working knowledge of these ideas, if they truly want to understand their work.
The End
Contact me: r.j.janse-5@umcutrecht.nl
More about me: rjjanse.github.io
These slides: rjjanse.github.io/talks/pet